前回の記事、「AmbientのCSVをpythonで処理してExcel(グラフ)化」において、その日の計測データを1つのワークシートにまとめ、系列毎にグラフを作成するところまで行いました。この記事では、その日の各系列の最大値と最小値とを抽出し、その月でのトレンドを現すグラフを作成するプログラムを作りました。計測の構成は、前回の記事と同じで、温度データが3系統、湿度データが3系統あります。アウトプットイメージとしては、温度を示すグラフでは、3系統の最大値のプロットと最大値のプロットを描画するので6本のグラフを作る感じです。湿度データについても同様です。
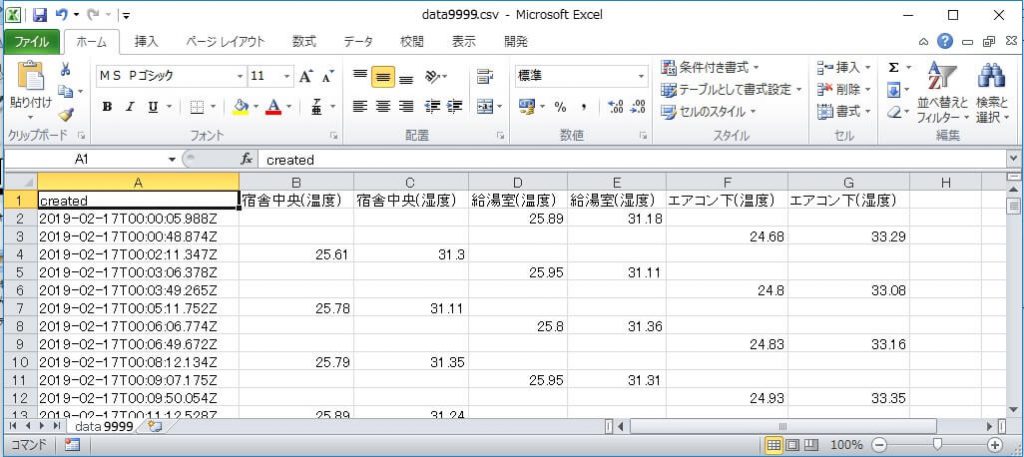
AmbientからダウンロードしたCSV
AmbientからダンロードしたCSVファイルは、下記に示すような感じです。33つのモジュールが独立して動作しているため、計測時間が異なるので各列に2行ずつ空白ができてしまっています。生データをローカルに保存するだけならこれでも良いかもしれませんが、今回の目的には使いづらいので、データの抽出からプログラムしました。
開発環境
下記の環境でプログラムを構築し実行しました。Anaconda を導入した時点でxlsxwriterは既に導入されていました。
- Windows10
- Anaconda Navigator v1.9.6
- python v3.7.1
- spyder v3.3.2
- xlsxwriter v1.1.2
プログラムの流れは、
・項目をExcelに記入
・日時別に温度や湿度のデータをリストに追加
・最大値と最小値とをExcelに記入
・3系統の最大値と最小値とをプロットしたグラフを作成
です。
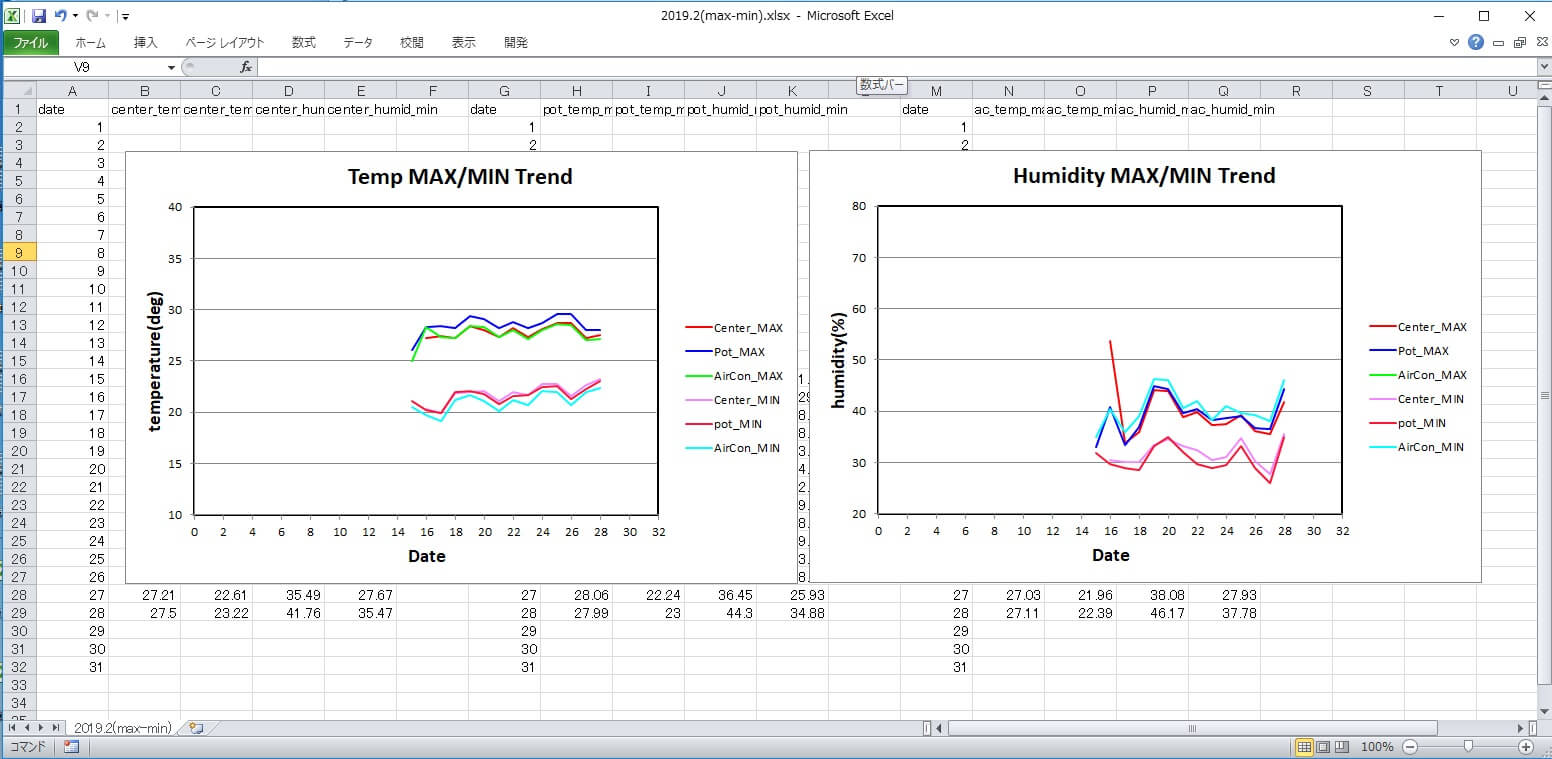
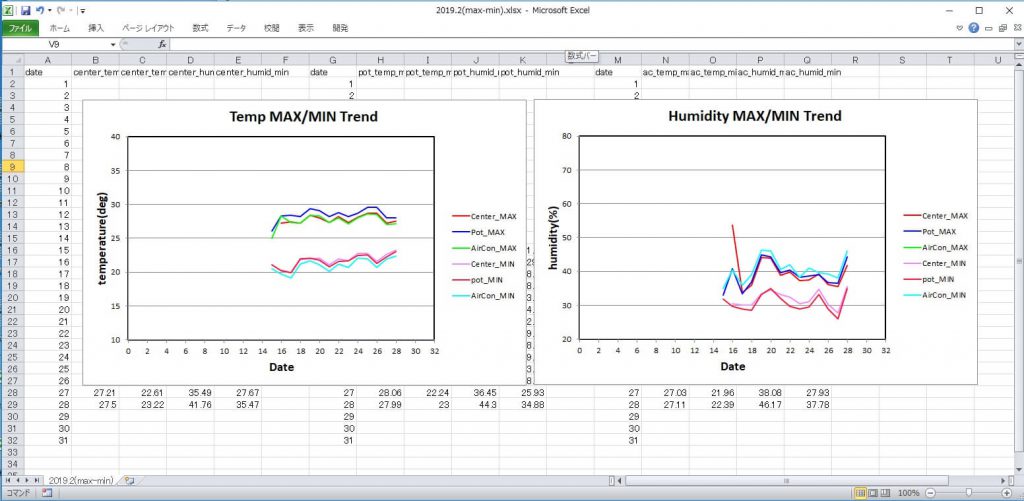
結果の画面
プログラムを実行して得られるExcelの画面を示します。これは2019年2月のデータで、本格的に計測を始めたのが17日からなので、約半月分の処理結果が描画されました。両グラフ共に、最高値のトレンドと最低値のトレンドとを一緒に描画し、部屋の温度および湿度の管理がひと目で分かるようになりました。だいぶxlsxwriterモジュールを使えるようになってきました。
プログラム
import xlsxwriter
YEAR = 2019 #希望の年を記入
MONTH = 2 #希望の月を記入
startDay = 1
endDay = 31
Number_of_Data = 6 #Ambientの1チャンネルが持つデータ系統数
#ワークブックとワークシートの作成
workbook = xlsxwriter.Workbook(str(YEAR)+"."+str(MONTH)+"(max-min).xlsx")
SpSheetName = str(YEAR) + "." + str(MONTH) + "(max-min)"
worksheet = workbook.add_worksheet(SpSheetName)
# 読み込むCSVファイル
NameOfFile = "data8974.csv"
# セル座標の初期化
center_row = 0
pot_row = 0
ac_row = 0
center_col = 0
pot_col = 6
ac_col = 12
# 項目を先に記述する
worksheet.write(center_row, center_col, "date")
worksheet.write(center_row, center_col + 1, "center_temp_max")
worksheet.write(center_row, center_col + 2, "center_temp_min")
worksheet.write(center_row, center_col + 3, "center_humid_max")
worksheet.write(center_row, center_col + 4, "center_humid_min")
center_row += 1
worksheet.write(pot_row, pot_col, "date")
worksheet.write(pot_row, pot_col + 1, "pot_temp_max")
worksheet.write(pot_row, pot_col + 2, "pot_temp_min")
worksheet.write(pot_row, pot_col + 3, "pot_humid_max")
worksheet.write(pot_row, pot_col + 4, "pot_humid_min")
pot_row += 1
worksheet.write(ac_row, ac_col, "date")
worksheet.write(ac_row, ac_col + 1, "ac_temp_max")
worksheet.write(ac_row, ac_col + 2, "ac_temp_min")
worksheet.write(ac_row, ac_col + 3, "ac_humid_max")
worksheet.write(ac_row, ac_col + 4, "ac_humid_min")
ac_row += 1
指定された日付の範囲で処理させるブロック
for i in range(startDay, endDay + 1):
# データを入力するリストを宣言center_temp = list()center_humid = list()pot_temp = list()pot_humid = list()ac_temp = list()ac_humid = list()with open(NameOfFile,mode="r",encoding="utf-8") as f:for line in f:buf = line.rstrip().split(",")# 先頭の文字列が"created"ではない時if not "created" in buf[0]:# タイムスタンプの文字列を分解して、年月日を抽出し、for i in range(startDay, endDay+1)の変数i。sbuf = buf[0].split("T")year, month, day = sbuf[0].split("-")if int(day) == i:# 宿舎中央のデータを抽出し、リストに加えるif buf[1] != "":center_temp.append(float(buf[1]))center_humid.append(float(buf[2]))# 給湯器のデータを抽出し、リストに加えるif buf[3] != "":pot_temp.append(float(buf[3]))pot_humid.append(float(buf[4]))# エアコン下のデータを抽出し、リストに加えるif buf[5] != "":ac_temp.append(float(buf[5]))ac_humid.append(float(buf[6]))else:pass# 宿舎中央の処理ブロック# リストにデータがある場合に最大値と最小値とを計算するif len(center_temp) > 0:worksheet.write(center_row, center_col, i)worksheet.write(center_row, center_col + 1, max(center_temp))worksheet.write(center_row, center_col + 2, min(center_temp))worksheet.write(center_row, center_col + 3, max(center_humid))worksheet.write(center_row, center_col + 4, min(center_humid))center_row += 1# リストにデータがない場合には、日付だけを書き込むelse:worksheet.write(center_row, center_col, i)center_row += 1# 給湯器の処理ブロック# リストにデータがある場合に最大値と最小値とを計算するif len(pot_temp) > 0:worksheet.write(pot_row, pot_col, i)worksheet.write(pot_row, pot_col + 1, max(pot_temp))worksheet.write(pot_row, pot_col + 2, min(pot_temp))worksheet.write(pot_row, pot_col + 3, max(pot_humid))worksheet.write(pot_row, pot_col + 4, min(pot_humid))pot_row += 1# リストにデータがない場合には、日付だけを書き込むelse:worksheet.write(pot_row, pot_col, i)pot_row += 1# エアコン下の処理ブロック# リストにデータがある場合に最大値と最小値とを計算するif len(ac_temp) > 0:worksheet.write(ac_row, ac_col, i)worksheet.write(ac_row, ac_col + 1, max(ac_temp))worksheet.write(ac_row, ac_col + 2, min(ac_temp))worksheet.write(ac_row, ac_col + 3, max(ac_humid))worksheet.write(ac_row, ac_col + 4, min(ac_humid))ac_row += 1# リストにデータがない場合には、日付だけを書き込むelse:worksheet.write(ac_row, ac_col, i)ac_row += 1
# 3種類の温度データを1つのグラフにするブロック
chart_temp = workbook.add_chart({"type": "scatter"})
chart_temp.set_x_axis({"name":"Date",
"name_font":{"size":14, "bold":True},
"min":0,
"max":32,
"major_unit":2})
chart_temp.set_y_axis({"name":"temperature(deg)",
"name_font":{"size":14, "bold":True},
"min":10,
"max":40,
"major_unit":5})
chart_temp.add_series({"categories":"="+SpSheetName+"!$A$2:$A$32",
"values":"=" + SpSheetName + "!$B$2:$B$32",
"name":"Center_MAX",
"line":{"width":1.5, "color":"#FF0000"},
"marker":{"type":"none"}})
chart_temp.add_series({"categories":"="+SpSheetName+"!$G$2:$G$32",
"values":"=" + SpSheetName + "!$H$2:$H$32",
"name":"Pot_MAX",
"line":{"width":1.5, "color":"#0000FF"},
"marker":{"type":"none"}})
chart_temp.add_series({"categories":"="+SpSheetName+"!$M$2:$M$32",
"values":"="+SpSheetName+"!$N$2:$N$32",
"line":{"width":1.5, "color":"#00FF00"},
"marker":{"type":"none"},
"name":"AirCon_MAX"})
chart_temp.add_series({"categories":"="+SpSheetName+"!$A$2:$A$32",
"values":"=" + SpSheetName + "!$C$2:$C$32",
"line":{"width":1.5, "color":"#F386FF"}, "marker":{"type":"none"},
"name":"Center_MIN"})
chart_temp.add_series({"categories":"=" + SpSheetName + "!$G$2:$G$32",
"values":"=" + SpSheetName + "!$I$2:$I$32",
"line":{"width":1.5, "color":"#FF1234"},
"marker":{"type":"none"},
"name":"pot_MIN"})
chart_temp.add_series({"categories":"=" + SpSheetName + "!$M$2:$M$32",
"values":"=" + SpSheetName + "!$O$2:$O$32",
"line":{"width":1.5, "color":"#00FFFF"},
"marker":{"type":"none"},
"name":"AirCon_MIN"})
chart_temp.set_size({"width":600, "height": 480})
chart_temp.set_title({"name":"Temp MAX/MIN Trend"})
chart_temp.set_plotarea({"border":{"color":"#000000","width":1.5, "dash_type":"solid"}})
worksheet.insert_chart("C7", chart_temp)
# 3種類の湿度データを1つのグラフにするブロック
chart_humid = workbook.add_chart({"type": "scatter"})
chart_humid.set_x_axis({"name":"Date",
"name_font":{"size":14, "bold":True},
"min":0,
"max":32,
"major_unit":2})
chart_humid.set_y_axis({"name":"humidity(%)",
"name_font":{"size":14, "bold":True},
"min":20,
"max":80,
"major_unit":10})
chart_humid.add_series({"categories": "=" + SpSheetName + "!$A$2:$A$32",
"values":"=" + SpSheetName + "!$D$2:$D$32",
"name":"Center_MAX",
"line":{"width":1.5, "color":"#FF0000"},
"marker":{"type":"none"}})
chart_humid.add_series({"categories": "=" + SpSheetName + "!$G$2:$G$32",
"values":"=" + SpSheetName + "!$J$2:$J$32",
"name":"Pot_MAX",
"line":{"width":1.5, "color":"#0000FF"},
"marker":{"type":"none"}})
chart_humid.add_series({"categories": "=" + SpSheetName + "!$M$2:$M$32",
"values":"=" + SpSheetName + "!PN$2:$P$32",
"line":{"width":1.5, "color":"#00FF00"},
"marker":{"type":"none"},
"name":"AirCon_MAX"})
chart_humid.add_series({"categories":"=" + SpSheetName + "!$A$2:$A$32",
"values":"=" + SpSheetName + "!$E$2:$E$32",
"line":{"width":1.5, "color":"#F386FF"},
"marker":{"type":"none"},
"name":"Center_MIN"})
chart_humid.add_series({"categories":"=" + SpSheetName + "!$G$2:$G$32",
"values":"=" + SpSheetName + "!$K$2:$K$32",
"line":{"width":1.5, "color":"#FF1234"},
"marker":{"type":"none"},
"name":"pot_MIN"})
chart_humid.add_series({"categories":"=" + SpSheetName + "!$M$2:$M$32",
"values":"=" + SpSheetName + "!$P$2:$P$32",
"line":{"width":1.5, "color":"#00FFFF"},
"marker":{"type":"none"},
"name":"AirCon_MIN"})
chart_humid.set_size({"width":600, "height": 480})
chart_humid.set_title({"name":"Humidity MAX/MIN Trend"})
chart_humid.set_plotarea({"border":{"color":"#000000","width":1.5, "dash_type":"solid"}})
worksheet.insert_chart("N7", chart_humid)
workbook.close()